


It's Hotter Today Than it Was Yesterday
Must be because of climate change

“It’s hotter today than it was yesterday- must be because of climate change”. After reading that, you’re surely (hopefully) thinking, “This guy is nuts, that’s just the weather.” That’s absolutely correct, but it does demonstrate the importance of considering timeframe when attempting to determine the legitimacy of claims that climate change is an existential threat to the survival of Planet Earth.
Comedian James Gregory brought a unique perspective to the subject, stating, “Let me tell you folks about global warming, especially you young folks out there. Don’t worry about it, and I’ll tell you why. Just trust me on this. For as long as I have been alive, it’s been hot in the summer. Now this right here is almost unbelievable. Some summers have been hotter than others.” Although intended strictly as part of a comedy routine, Gregory’s comments are a revealing reference to the timeframe being the most relevant factor when assessing climate.
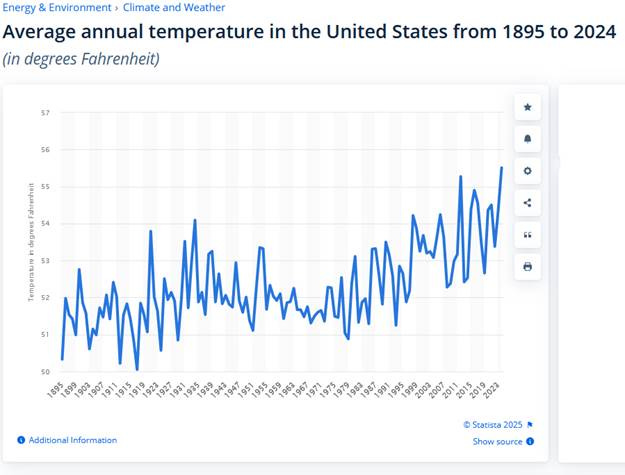
Over longer periods of time, temperature variations demonstrate Gregory’s point- some years are hotter than others. According to weather.gov, at the dawn of the Industrial Revolution, the highest average annual US temperatures were 53.9°F in 1900 and 54.5°F in 1910. From 1900 to 1909, average temperatures varied, rising and falling, with a low of 50.1°F in 1908. The high of 54.5°F in 1910 was followed by a similar sawtooth pattern dropping to a low of 50.7°F in 1917, before rising to 54.4°F in 1921.
During the entire time from 1895 to the 2020s, the pattern remains much the same, rising and falling from year to year, as shown in the accompanying graph from statista.com. Overall, the pattern shows a general warming trend since the late 1970s.
The rise and fall of average U.S. temperatures is mirrored by global temperature averages as shown in a graph from Copernicus, but it shows temperatures only between 1940 and the early part of 2025. (If you go to the Copernicus website, you can click in the gray area of the graph to display the trace for a specific year.)

The graphic below shows each year’s temperature difference from the 1991 to 2020 average for global temperatures and arctic temperatures. Notice that the two don’t track each other. Although the trends are similar, the graph lines diverge in a number of years, with global and Arctic temperature differences diverging, or one moving significantly more than the other.
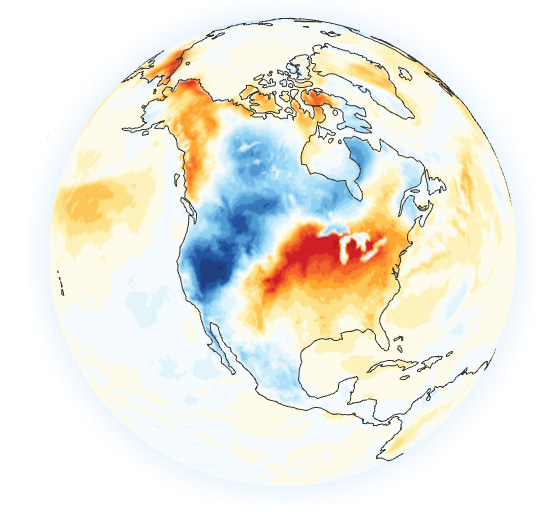
Also revealing is the world map that shows temperature differences from the 1991-2020 average by area. The image for 6/10/25 shows that some areas of the globe were warmer than average, but many areas of the United States, Greenland, and parts of Europe and Russia were cooler. (If you go to the Copernicus website, you can click on the globe and rotate it to see all parts of the world.)

The statistics cited above demonstrate the fallacy of climate alarmists’ doomsday predictions that Planet Earth is on the precipice of a climate cataclysm. Statistics conclusively demonstrate that global temperatures have increased in the past 50 years, but not to the doomsday levels often predicted. And prior to the current claims that “the sky is falling”, climate scientists were predicting an entirely different type of doomsday- a new ice age.
An April 1975 Newsweek article entitled “The Cooling World” presented the dire scientific prediction that cooling temperatures would soon wreak havoc with food production. As stated in the article, “To the layman, the relatively small changes in temperature and sunshine can be misleading. Reid Bryson of the University of Wisconsin points out that the Earth’s temperature during the great Ice Ages was only about 7 degrees lower than during its warmest eras- and that the present decline has taken the planet about a sixth of the way toward the Ice Age average. Others regard the cooling as a reversion to the ‘little ice age’ conditions that brought bitter winters to much of Europe and northern America between 1600 and 1900, years when … iceboats sailed the Hudson River almost as far south as New York City”.
Which brings us back to James Gregory’s statement, “Now this right here is almost unbelievable. Some summers have been hotter than others,” and the corollary, some winters are colder than others. That also brings us back to the timeframe. Claims that 2024 was the warmest year on record usually omit the fact that the referenced record dates back only to 1850.
Expanding the reference time frame to 11,000 years presents a different picture. As shown here, as recently as 2,500 years ago, average temperatures were higher than they are today, then cooled, creating the “Little Ice Age” which lasted until the 1850s.
Climate alarmists blame the current warming trend almost entirely on greenhouse gas emissions created by human activity, a claim that is demonstrably false. According to CO2 Coalition, global CO2 emissions from the burning of fossil fuels, cement manufacturing, and gas flaring have risen dramatically between 1940 and the present. Yet the peak average temperature in 2022 was less than 2 degrees (F) higher than the peak in 1931. Further, while CO2 emissions from human activities were rapidly rising, it wasn’t until 1998 that the peak average temperature rose to the 1931 level. If CO2 emissions from human activities are the primary driver of climate change, why did average peak temperatures remain below the 1931 level for over 67 years?
Probably because the primary driver of global temperatures is not CO2, but the sun and the natural events it triggers. Long before the industrial age, the same climate changes we currently experience occurred. Further, the amount of CO2 produced by human activities is a mere fraction of the amount created by natural events such as outgassing from the ocean, decomposing vegetation and other biomass, venting volcanoes, and naturally occurring wildfires. If CO2 emissions from human activities were reduced to zero, atmospheric concentrations would still rise and fall as a result of natural events.
Going forward, well-reasoned policies affecting all emissions from human activities will be beneficial. However, a "hair on fire” approach to eliminating CO2 emissions is ill-advised and ultimately counterproductive, as demonstrated by the fact that the Kyoto Protocols and the Paris Climate agreement (which is focused primarily on wealth redistribution) have had absolutely no effect on atmospheric CO2 levels, which have continued to rise.